Irrational thinking and the EU Referendum result.
Originally posted 16th June 2016. Last Updated 26th April 2017.
Preliminary research findings from ‘The Online Privacy Foundation’ suggests that a voter’s ability to think rationally about the evidence for a referendum topic distinctly depends on whether or not that evidence supports their existing views.
Most people appear to be unable to interpret a set of numbers correctly if the evidence doesn’t support their existing and arguably psychologically biased position on a topic. This happens to voters on both sides of the referendum debate. But there are differing levels of this phenomenon depending on which side of the debate someone is instinctively drawn to.
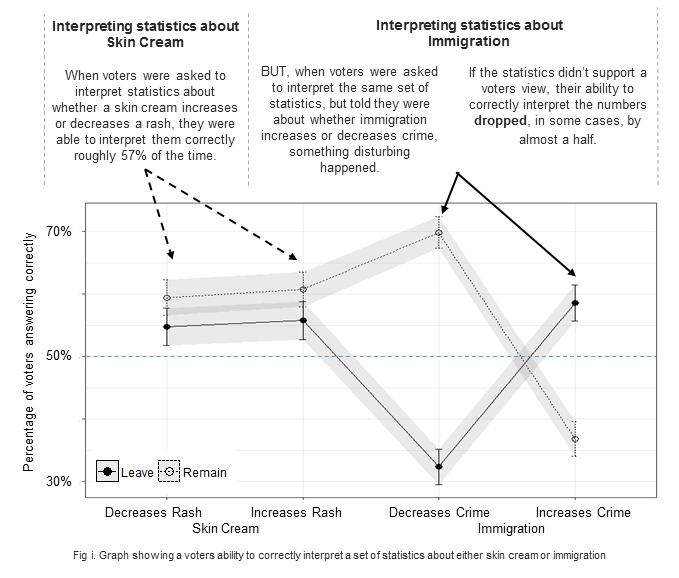
The image below illustrates the effects of immigration motivated numbers ( on the right hand side) versus control questions regarding the effectiveness of skin cream treatments (on the left hand side).
The study, one of six the organization has conducted on the EU Referendum, replicated research by Yale Professor, Dan Kahan and observed the same phenomenon. Kahan’s research was dubbed ‘The Most Depressing Brain Finding Ever’.
The findings also support the observations of influential psychologist Professor Daniel Kahneman. In a 2016 Telegraph article, Kahneman warned that British voters are succumbing to impulsive gut feelings and irrational reflexes in the Brexit campaign. These research findings suggest that he’s right.
“An understanding of the biases and personality differences we express through our online activities is likely to enable political marketers to better target messages, manipulate people and ultimately influence how they will vote. As an organisation, we’re interested in investigating and exposing the extent to which these traits and biases are and could be exploited online” said Chris Sumner, co-founder of the Online Privacy Foundation.
The interim findings are from a series of Facebook studies conducted by ‘The Online Privacy Foundation’ which examined the psychological biases, personality traits and attitudes of 11,205 voters in the UK’s Referendum on EU membership.
Additional Findings
The Online Privacy Foundation also found that voters on both sides of the debate:
• Overestimated their ability on a logic test to be much higher than it really was, with older voters overestimating their abilities the most. See Fig 3.
• Are likely to discount the validity of a numerical test if they are told voters with opposing views tend to get more questions right in the test. See Fig 11.
• Make predictably riskier choices depending on how the choices are phrased. See Fig 5. E.g. if a smoker is told that their chances of getting terminal lung cancer will increase from 1% to 1.3%, they’re unlikely to consider quitting. If they’re told that they’ll increase their chances of dying by 30%, they are more likely to consider quitting, even though the numbers involved are identical.
Further comparison shows that, as a group:
| Leave Voters | Remain Voters |
| More authoritarian, scoring higher in the disposition associated with the upkeep and following of established societal traditions and a tendency to be less accepting of outsiders. People scoring higher in authoritarianism also have a greater tendency toward dogmatism and solipsism (inwardness).
See Fig 8
|
More liberal. scoring slightly higher in the Personality Trait of Openness, the trait associated with liberal ethics, tolerance and attraction to new experiences. |
| Display significantly lower levels of numeracy (Fig 7) and appeared more reliant on impulsive ‘System 1’ thinking (Fig 6).
|
More concerned about privacy rights, agreeing less with the statement “With regards to internet privacy, if you’ve done nothing wrong, you’ve got nothing to fear”. |
| More religious, being more likely to agree with the statement “I would describe myself as religious” | More concerned about human rights, strongly disagreeing with the statement ‘The Human Rights Act does nothing for ordinary people’ |
A note on undecided voters: Voters who hadn’t decided their vote prior to the campaigns starting, appear to be caught between the two authoritarian extremities. See Fig 9.
The studies form part of a larger research project which seeks to understand the extent to which these biases and traits are being targeted and manipulated online.
Contact chris@onlineprivacyfoundation.org for further information.
Related news on Psychology, Ideology and the UK referendum on EU membership:
- It’s NOT the economy, stupid: Brexit as a story of personal values (London School of Economics Blog – July 7th, 2016)
- The EU referendum is behavioural economics’ largest experiment yet (Medium, June 23rd, 2016)
- Values, Voting, and Expertise How far can we trust experts when we’re deciding how to vote? (Psychology Today – June 21st, 2016)
- The UK’s EU Referendum – The Moral Psychological Landscape (Politics is Moral Psychology – June 20th, 2016)
- The psychology of voting: what’s really driving your decision on Brexit (The Telegraph – June 20th, 2016)
- ‘Irritation and anger’ may lead to Brexit, says influential psychologist (The Telegraph – June 5th, 2016)
- Why gut instinct will decide the most irrational referendum yet (New Scientist – June 1st, 2016)
- Why Right-Wingers Think the Way They Do: The Fascinating Psychological Origins of Political Ideology (Alternet – April 28th, 2014)
- Most Depressing Brain Finding Ever (The Huffington Post – September 16th, 2013)
- Science confirms: Politics wrecks your ability to do math (Grist – September 8th, 2013)
Further Discussion at the Yale Law School Cultural Cognition Project – Is even the vote (not to mention all the voting) on Brexit irrational?…
Notes:
- Further analysis of the interim results are provided below.
- A graphic of voter intentions by Age Group and Sex is available here in png format.
- A graphic of answers to 14 questions related to the EU Referendum is available here in png format.
- Interim statistics will be available upon request to chris@onlineprivacyfoundation.org
- The Online Privacy Foundation are in the process of writing up a formal paper for future submission to a journal or conference, after which, anonymous, raw data will be made available to academic and independent researchers upon request.
- The Online Privacy Foundation is a non-political organization and the research does not express an opinion on behalf of the Online Privacy Foundation.
- The Online Privacy Foundation received no funding for these surveys and are not affiliated with any EU Referendum campaign.
Further Analysis of Interim Findings
Motivated Numeracy
Voters (on both sides) ability to interpret referendum related figures depends on whether the figures support their referendum positions and beliefs. If the figures run counter to their beliefs, otherwise numerically literate people become, essentially, numerically illiterate.
Sample Size: 2242
Method: We replicated Dan Kahan’s research, titled ‘Motivated Numeracy and Enlightened Self-Government’.
In our experiment, participants were randomly assigned to one of four groups, A,B, C or D. Groups A and B received the same question topic, a topic concerning the efficacy of skin cream. Groups C and D each received a question regarding Immigration and crime (Kahan had used gun control is his research).
Groups A and B each received the following text:
“Medical researchers have developed a new cream for treating skin rashes. New treatments often work but sometimes make rashes worse. Even when treatments don’t work, skin rashes sometimes get better and sometimes get worse on their own. As a result, it is necessary to test any new treatment in an experiment to see whether it makes the skin condition of those who use it better or worse than if they had not used it.
In each group, the number of of people whose skin condition got better and the number whose skin condition got worse are recorded in the table below. Because patients do not always complete studies, the number of patients in each two groups is not exactly the same, but this does not prevent assessment of the results.
Please indicted whether the experiment shows that used the new cream is likely to make skin condition better or worse”
Depending on the group, the order of the effect was change by reordering the column headings. The tables presented to participant are shown below, with the correct answers highlighted.
| Group A – Control Condition #1 | Group B – Control Condition #2 | |||||
| Rash Got Worse | Rash Got Better | Rash Got Better | Rash Got Worse | |||
| Patients who did use the new skin cream | 223 | 75 | Patients who did use the new skin cream | 223 | 75 | |
| Patients who did NOT use the new skin cream | 107 | 21 | Patients who did NOT use the new skin cream | 107 | 21 | |
| A – People who used the skin cream were more likely to get BETTER than those didn’t | A – People who used the skin cream were more likely to get BETTER than those didn’t | |||||
| B – People who used the skin cream were more likely to get WORSE than those didn’t | B – People who used the skin cream were more likely to get WORSE than those didn’t | |||||
Groups C and D had the same numbers, with the same reordering, but the question text was changed to:
“Researchers have been investigating whether immigration increases crime, decreases crime or has no effect. In order to answer this question, the researches divided cities in to two groups: one consisting of 10 cities who had experienced the highest immigration and another that had experienced the lowest levels of immigration. They then observed the number of cities that had experienced ‘decreases in crime’ and those that experienced ‘increases in crime’ in the next year. The researchers accounted for economic and other differences in their analysis.
In each group, the crime numbers are recorded in the table below. Because cities have different crime figures, the number of crimes in the each of the two groups is not exactly the same, but this does not prevent assessment of the results.
Please indicate whether the research shows that immigration is likely to increases crime or decrease it.”
As with the control group, depending on the group, the order of the effect was change by reordering the column headings. The tables presented to participants are shown below, with the correct answers highlighted.
| Group C – Remain Biased | Group D – Leave Biased | |||||
| Increase in crime | Decrease in crime | Decrease in crime | Increase in crime | |||
| Cities with the highest levels of immigration | 223 | 75 | Cities with the highest levels of immigration | 223 | 75 | |
| Cities with the lowest levels of immigration | 107 | 21 | Cities with the lowest levels of immigration | 107 | 21 | |
| A – Cities with the highest immigration were more likely to have LESS crime than those didn’t | A – Cities with the highest immigration were more likely to have LESS crime than those didn’t | |||||
| B – Cities with the highest immigration were more likely to have MORE crime than those didn’t | B – Cities with the highest immigration were more likely to have MORE crime than those didn’t | |||||
Context: We include this experiment as Professor Kahan had identified that “subjects responses became politically polarized-and even less accurate-when the same data were presented as results from [studies C and D]” and consider it and important aspect to assess.
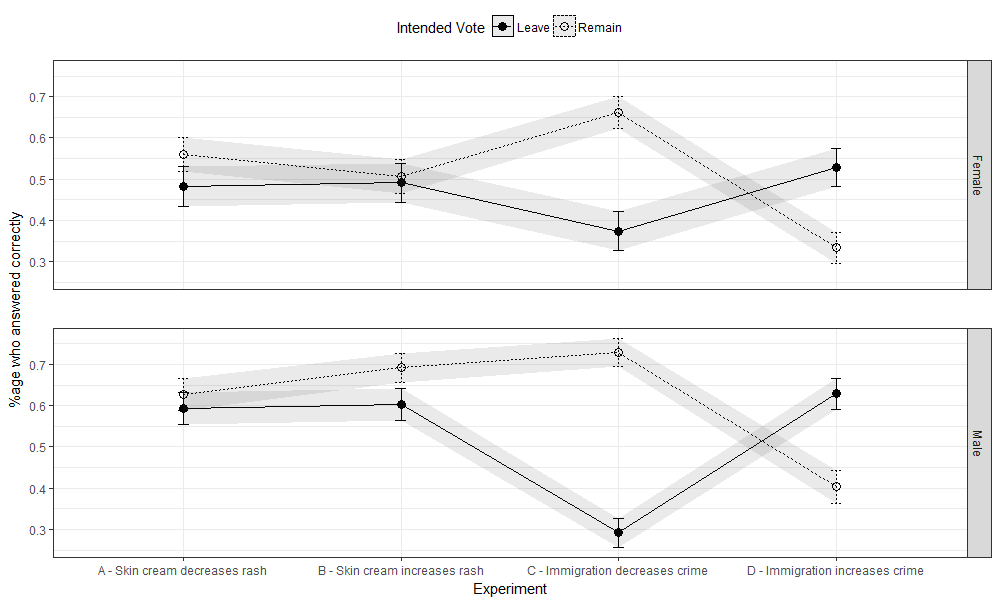
Figure 1. The irrationality of EU Referendum voters
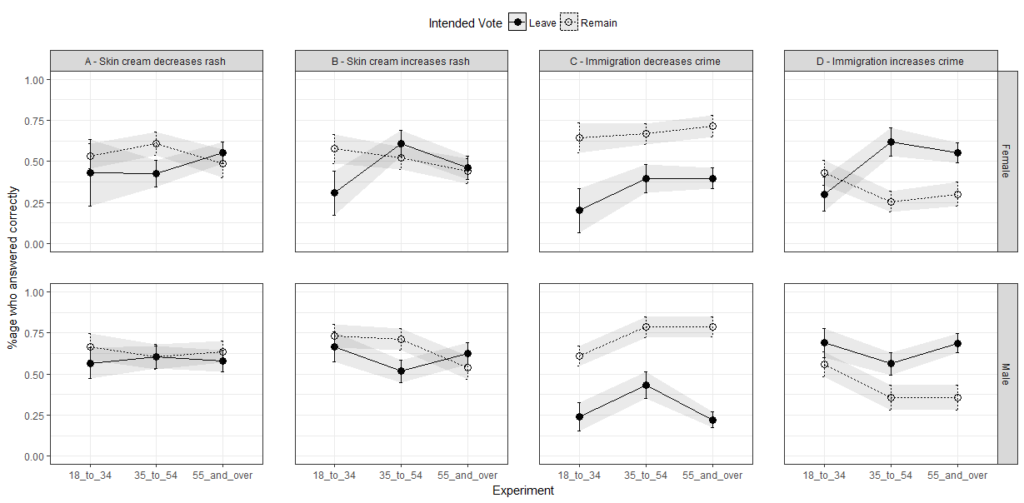
Figure 2. In this graph, the Y axis represents the mean score on the single question (skin cream or immigration), while the X axis represents study participants age groups.
The Dunning-Kruger Effect
Voters on both sides of the referendum decision over estimated their abilities to a similar degree, although older participants tended to over estimate far more than their younger counterparts.
Sample Size: 1,548
Method: After completing the Wason-Card Selection task (with permission, we replicated this version), participants were asked how many questions they thought they had answered correctly. Participant’s actual performance was then subtracted from their estimated performance to provide a measure of over confidence.
Context: The test was provided in order to measure the Dunning-Kruger Effect, a cognitive bias which asserts that less competent people rate their competence higher than it actually is, while more competent people humbly rate theirs lower.
Figures:
Figure 3, to the right, shows participants level of over-confidence based on subtracting their actual performance from their self-predicted performance.
Figure 4, show actual performance by Age Group and Sex versus estimated performance.
(1) Kruger, Justin, and David Dunning. “Unskilled and unaware of it: how difficulties in recognizing one’s own incompetence lead to inflated self-assessments.” Journal of personality and social psychology 77.6 (1999): 1121.
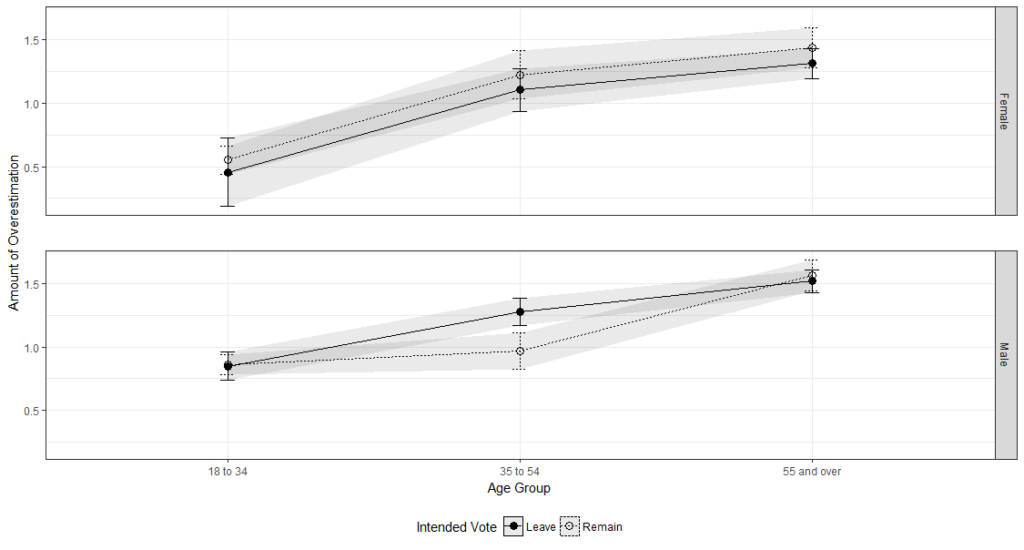
Figure 3. Dunning Kruger Effect. The overlapping Confidence Bands suggest there’s no difference between voters with opposing views
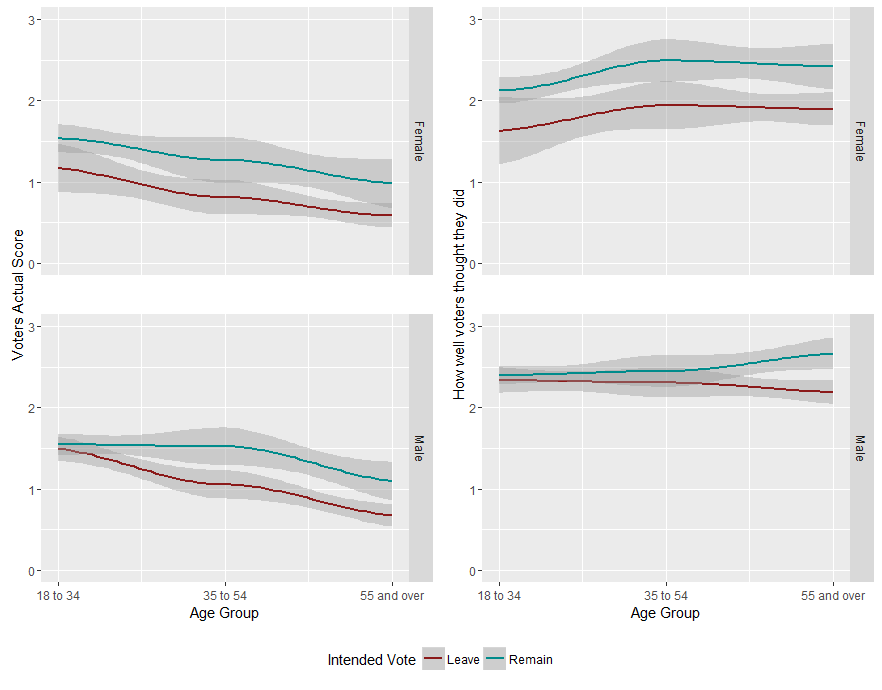
Figure 4. The graphs on the left show actual performance, while the graphs on the right show estimated performance. Voters on both sides of the debate overestimate their performance.
The Framing Effect
Voters on both sides of the referendum decision make predictably riskier choices depending on how the choices are phrased. E.g. if a smoker is told that their chances of getting terminal lung cancer will increase from 1% to 1.3%, they’re unlikely to consider quitting. If they’re told that they’ll increase their chances of dying by 30%, they are more likely to consider quitting, even though the numbers involved are identical. (The Framing Effect).
Sample Size: 1597
Method: We used ‘The Asian Disease problem’ which originates from Tversky and Kahneman’s 1981 paper ‘The Framing of Decisions and the Psychology of Choice’.. In our study participants were asked to “imagine that the U.K. is preparing for the outbreak of an unusual Asian disease, which is expected to kill 600 people. Two alternative programs to combat the disease have been proposed. Assume the exact scientific estimate of the consequences of the programs are as follows”. Participants were then randomly assigned to one of two question groups.
Group 1 were presented with a (positively framed) choice between:
Program A: “200 people will be saved”
Program B: “there is a 1/3 probability that 600 people will be saved, and a 2/3 probability that no people will be saved“
Note: Typically, the majority of people choose program A.
Group 2 were presented with a (negatively framed) choice between:
Program C: “400 people will die”
Program D: “there is a 1/3 probability that nobody will die, and a 2/3 probability that 600 people will die“
Note: Given this choice, typically the majority of people choose program D.
Programs A and C are identical, as are programs B and D. The change in the decision frame between the two groups of participants produced a preference reversal: when the programs are presented in terms of lives saved, participants tend to prefer the secure program, A (equivalent to C in Group 2). When the programs are presented in terms of expected deaths, participants tend to chose the gamble D (equivalent to B in Group 1).
Context: We included this test to see whether there were differences in people’s attitudes to safe options versus gambles, arguably an interesting area of study in relation to the EU Referendum given the framing of important arguments in the press and online.
Tversky, Amos, and Daniel Kahneman. “The framing of decisions and the psychology of choice” Science 211.4481 (1981): 453-458.
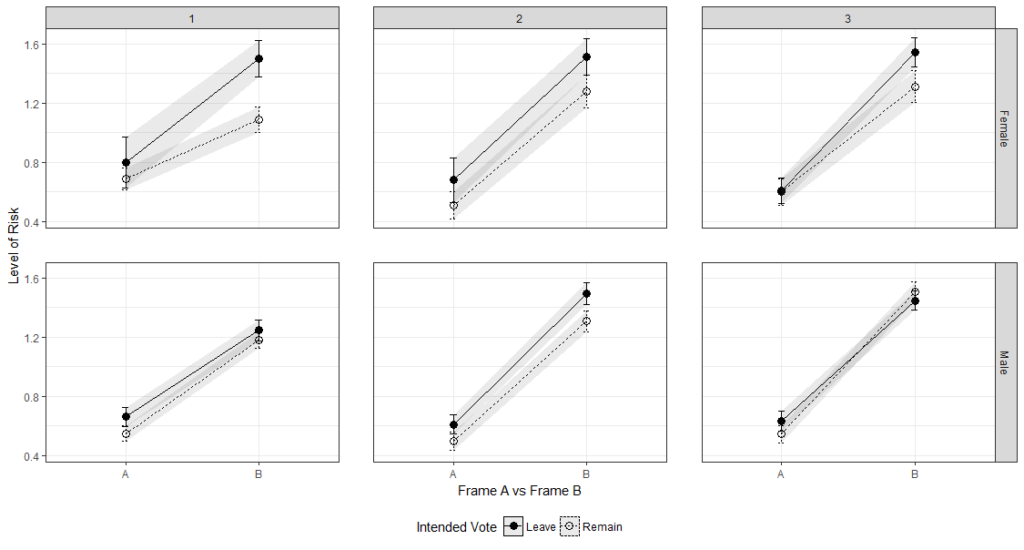
Figure 5. The graphs shows voters ‘riskiness’ level for the positively framed choices (A) and their ‘riskiness’ levels for the negatively framed choices (B). Here we see notable differences between the two decision frames, with voters on both sides of the referendum equally susceptible.
Cognitive Reflection Test & Risk Literacy
EU Referendum voters intending to vote ‘Remain’ typically appear to:
• Have a better grasp of statistical and risk literacy, making them more skilled at evaluating the pros and cons of important decisions such as financial investments.
• Perform better at questions where there is an intuitive, but incorrect answer than people intending to vote ‘Leave’. This suggests they have a higher tendency for reflective, analytical “System 2” thinking and a greater ability to resist the mental shortcuts which can lead to instinctive, but incorrect answers.
NOTE: Has we have seen, this advantage is destroyed, when the the statistical evidence they’re evaluating is counter to their beliefs. The same is true for ‘Leavers’, but they appear to start of at a disadvantage.
Sample Size: The study was performed three times with 1,470 participants in the first study and 1,597 participants in the second and 2,242 in the third. All three studies had broadly similar results.
Method: Participants were presented with the following 3 questions from the Cognitive Reflection Test, developed by Professor Shane Frederick, Massachusetts Institute of Technology.
(1) A bat and a ball cost £1.10 in total. The bat costs £1.00 more than the ball. How much does the ball cost? _____ pence
(2) If it takes 5 machines 5 minutes to make 5 widgets, how long would it take 100 machines to make 100 widgets? _____ minutes
(3) In a lake, there is a patch of lily pads. Every day, the patch doubles in size. If it takes 48 days for the patch to cover the entire lake, how long would it take for the patch to cover half of the lake? _____ days
Context: The Cognitive Reflection Test is designed to measure a persons ability to suppress an intuitive and spontaneous (“System 1”) wrong answer in favour of a reflective and deliberative (“System 2”) right answer. Cognitive Reflection may therefore be an important factor to consider in debates where conflicting numbers are presented
Additional Tests: Similar results were also observed when we conducted the Berlin Numeracy Test, which is described as one of the world’s most efficient predictors of skilled decision making and risk literacy. RiskLiteracy.org state that
“The Berlin Numeracy Test was found to be the strongest predictor of comprehension of everyday risks (e.g., evaluating claims about products and treatments; interpreting forecasts), doubling the predictive power of other numeracy instruments and accounting for unique variance beyond other cognitive tests (e.g., cognitive reflection, working memory, intelligence).”
You can read more about it here.
Figures: Figure 6 shows voters Cognitive Reflection Test scores by age and sex
Frederick, Shane. “Cognitive reflection and decision making.” The Journal of Economic Perspectives 19.4 (2005): 25-42.
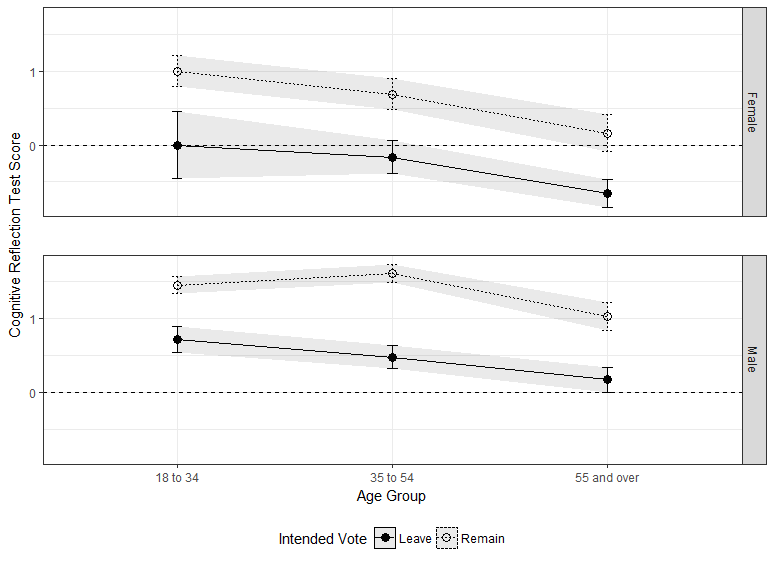 Figure 6. Cognitive Reflection Test Scores, as expected, decline with age. Differences are more pronounced in male voters.
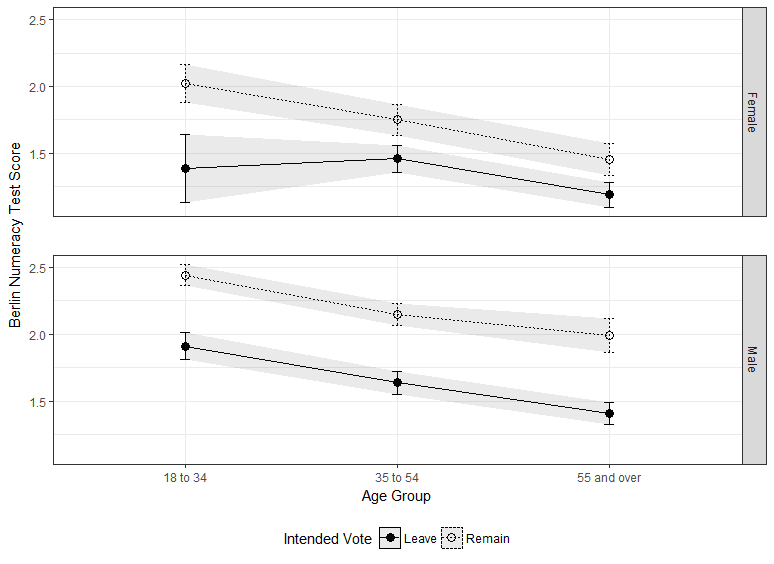
Figure 7. Berlin Numeracy Test Results show similar trends to Cognitive Reflect Test results, again with differences more noticeable in males.
Right Wing Authoritarian (RWA) Scale
Referendum voters intending to vote ‘Leave’ scored significantly higher in the personality trait of Right Wing Authoritarianism, the trait associated with the upkeep and following of established societal traditions, family values and a tendency to be less accepting of outsiders.
Sample Size: 1,597
Method: Participants were presented with the 22 question Right Wing Authoritarian Scale, reproduced, with permission from Chris W. Johnson’s web-site here, which is adapted from the material in Dr. Altemeyer’s book. The Authoritarians, pp. 10-15, chapter 1.
Sample questions include:
(1) The only way our country can get through the crisis ahead is to get back to our traditional values, put some tough leaders in power, and silence the troublemakers spreading bad ideas.
(2) The “old-fashioned ways” and the “old-fashioned values” still show the best way to live.
(3) Homosexuals and feminists should be praised for being brave enough to defy “traditional family values.”
Context: The Right Wing Authoritarian Scale was included as the referendum was arguably the raison d’etre of right wing UKIP party. It was therefore anticipated that there would be a correlation between referendum voting and political orientation.
The lowest total possible score on the RWA scale would be 20 and the highest, 180. In prior studies in the United States, Democrats tend to score between 60 and 110, while Republicans tend to score between 110 and 130 (See https://america.pink/images/3/7/5/1/0/4/2/en/3-right-wing-authoritarianism.jpg).
“Authoritarians are generally more favorable to punishment and control than personal freedom and diversity. For example, in the United States, they are more willing to suspend constitutional guarantees of liberty such as the Bill of Rights. They are more likely to advocate strict, punitive sentences for criminals, and report that punishing such people is satisfying for them. They tend to be ethnocentric and prejudiced against racial and ethnic minorities and homosexuals.”
Figures:
Figure 8, to the right, shows the self-reported RWA scores of EU Referendum voters by age and sex.
Figure 9, shows where the undecided voters fell on the RWA scale.
(1) Survey and associated text ©2006 Bob Altemeyer. The Authoritarian survey used in this study was reproduced, with permission from Chris W. Johnson’s web survey at http://www.panojohnson.com/automatons/rwa-scale.xhtml
(2) Ford, Robert, and Matthew Goodwin. “Understanding UKIP: Identity, social change and the left behind.” The Political Quarterly 85.3 (2014): 277-284.
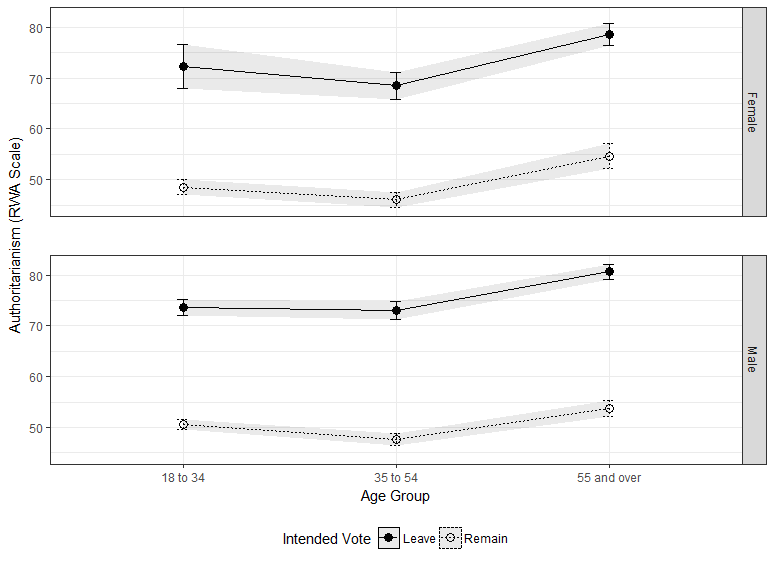
Figure 8. Graphs showing ‘Right Wing Authoritarianism’ with clear differences between voters
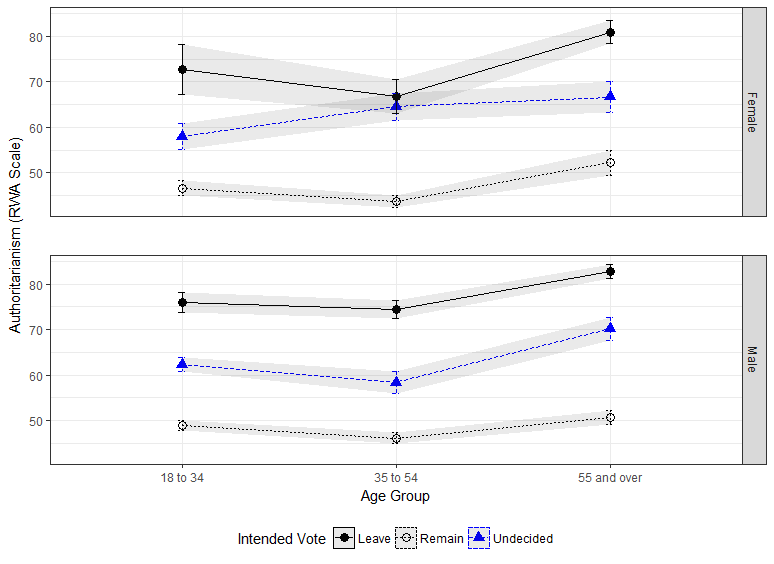
Figure 9. Voters who hadn’t decided their vote prior to the campaigns starting, appear to be caught between the two ideological extremities. Remain voters are more ‘Left Wing’, Leave voters are more ‘Right Wing’, the Undecided voters are in the middle
Personality Trait of Openness
Referendum voters intending to vote ‘Remain’ tended to score slightly higher in the Personality Trait of Openness, the trait associated with liberal ethics, tolerance and attraction to new experiences.
Method: Participants were presented with the 44 question Big Five Inventory (BFI), a version of which you can access at the OutofService website here.
Context: Personality traits are often reflective of a number of behaviours, including political orientation. Further, the trait of Openness is associated with liberalism and inclusions, traits we hypothesized to see more of in ‘Remain’ voters. It was therefore felt that the inclusions of the Big Five Inventory was appropriate.
The following provides a good overview of Openness:
“Openness is a general appreciation for art, emotion, adventure, unusual ideas, imagination, curiosity, and variety of experience. People who are open to experience are intellectually curious, open to emotion, sensitive to beauty and willing to try new things. They tend to be, when compared to closed people, more creative and more aware of their feelings. They are also more likely to hold unconventional beliefs.
A particular individual, however, may have a high overall openness score and be interested in learning and exploring new cultures but have no great interest in art or poetry. There is a strong connection between liberal ethics and openness to experience such as support for policies endorsing racial tolerance. Another characteristic of the open cognitive style is a facility for thinking in symbols and abstractions far removed from concrete experience. People with low scores on openness tend to have more conventional, traditional interests. They prefer the plain, straightforward, and obvious over the complex, ambiguous, and subtle. They may regard the arts and sciences with suspicion or view these endeavors as uninteresting. Closed people prefer familiarity over novelty; they are conservative and resistant to change”
Source: Wikipedia
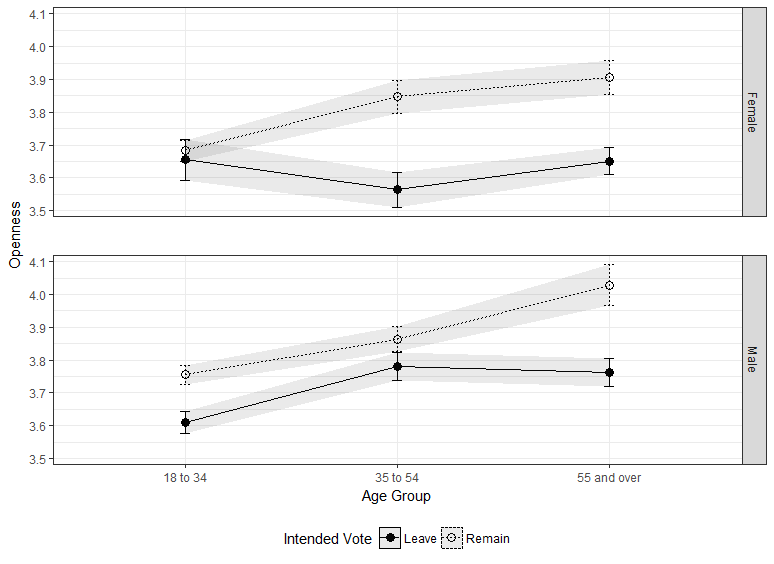
Figure 10. Graphs showing the Personality Trait of Openness, with differences between voters.
Ideologically motivated reasoning
Voters ob both sides of the referendum are equally likely to discount the validity of a numerical test if they are told voters with opposing views tend to get more questions right in the test.
Sample Size: 1,470
Method: We replicated Dan Kahan’s research, titled ‘Ideology, motivated reasoning and cognitive reflection’. In our experiment, people who took part in the Cognitive Reflection Test, above, were split randomly in to three groups. Upon completion of the test, each group was asked to rate, on a scale of 1 to 5, the validity of the test.
All groups were presented with the text “I think the word problem test I just took supplies good evidence of how reflective and open-minded someone is” before being asked to provide the rating.
The first group were provided with NO additional context.
The second group were additionally provided with the following text before being asked to provide a rating.
“In one recent study, a researcher found that people who intend to vote to ‘Leave’ the EU tend to get more answers right that those who intend to vote ‘Remain’. If the test is a valid way to measure open-mindedness, that finding would imply that those who intend to vote ‘Leave’ are more open-minded that those who intend to vote ‘Remain’.”
The third group were additionally provided with the following text before being asked to provide a rating.
“In one recent study, a researcher found that people who intend to vote to ‘Remain’ in the EU tend to get more answers right that those who intend to vote ‘Leave’. If the test is a valid way to measure open-mindedness, that finding would imply that those who intend to vote ‘Remain’ are more open-minded that those who intend to vote ‘Leave’.”
Context: This experiment was included as a previous study had found that people scoring higher on the Cognitive Reflection Test, a test often associated with Openness (above) ,were equally likely to dismiss the validity of the test if they are told opposing voters tended to get more questions right.
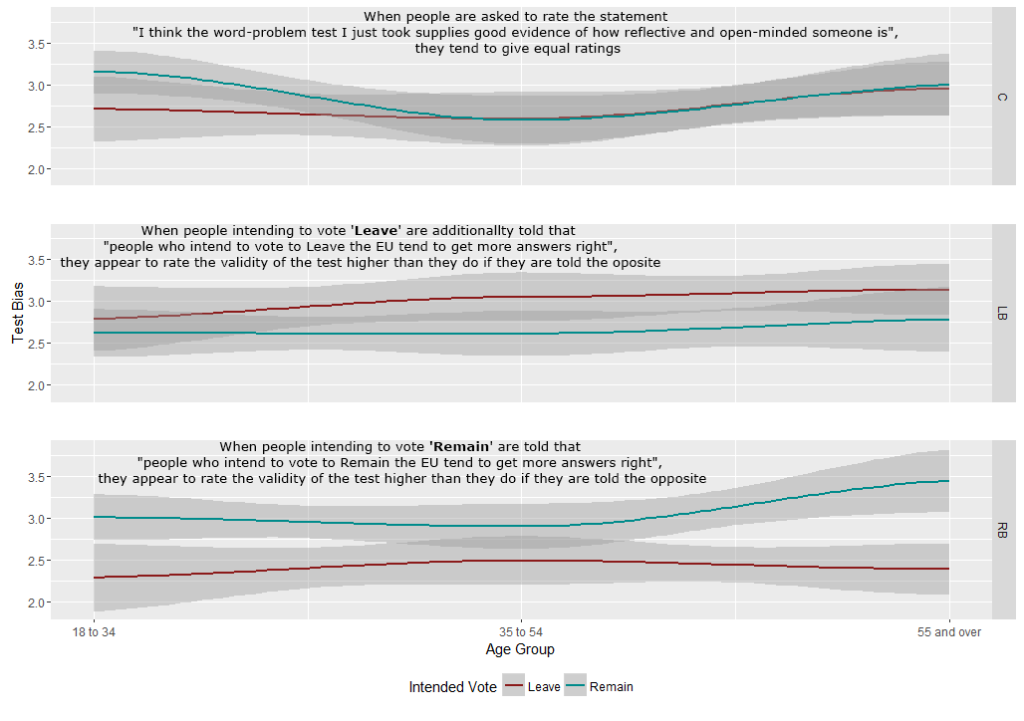
Further discussion: The graph to the right shows that:
• When people intending to vote ‘Remain’ are told that “people who intend to vote to Remain in the EU tend to get more answers right…”, they appear to rate that validity of the test higher than they do if they are told the opposite.
• When people intending to vote ‘Leave’ are told that “people who intend to vote to Leave the EU tend to get more answers right…”, they appear to rate that validity of the test higher than they do if they are told the opposite.
• When people are only asked to rate the statement “I think the word problem test I just took supplies good evidence of how reflective and open-minded someone is”, with no additional text, they tend to give more equal ratings.
The nature of the results and graphs suggest that this is a phenomenon worth further investigation. Professor Dan Kahan, at Yale, observed this in his paper ‘Ideology, motivated reasoning and cognitive reflection‘.
Kahan, Dan M. “Ideology, motivated reasoning, and cognitive reflection: an experimental study.” Judgment and Decision Making 8 (2012): 407-24.
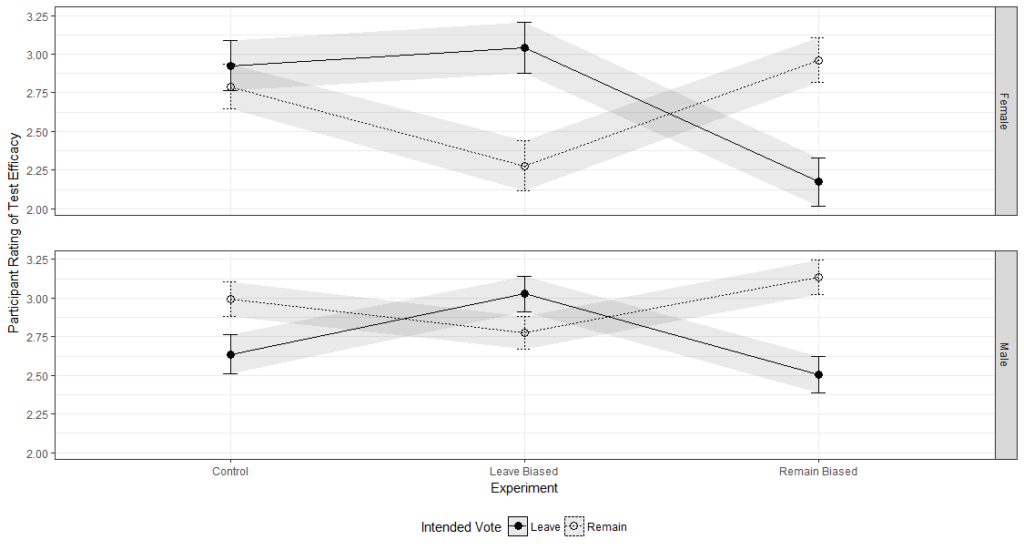
Figure 11. Graphs illustrating the phenomenon where voters will rate the efficacy of a lower if they are told that opposing voters tended to get more questions right.
Attitudes to Privacy
Referendum voters intending to vote ‘Remain’ tended to agree less with the statement “With regards to internet privacy, if you’ve done nothing wrong, you’ve got nothing to fear”.
Sample Size: The study was performed twice with 1,597 participants in the first study and 1,548 participants in the second.
Method: Participants were presented with the following question designed to capture attitudes to privacy and asked to rate, on a scale of 1-5, how much they agreed with the statement 1 = Strongly Disagree, 5 = Strongly Agree.
“With regards to internet privacy, if you’ve done nothing wrong, you’ve got nothing to fear”.
Figure 12, to the right shows self reported privacy scores by age and sex.
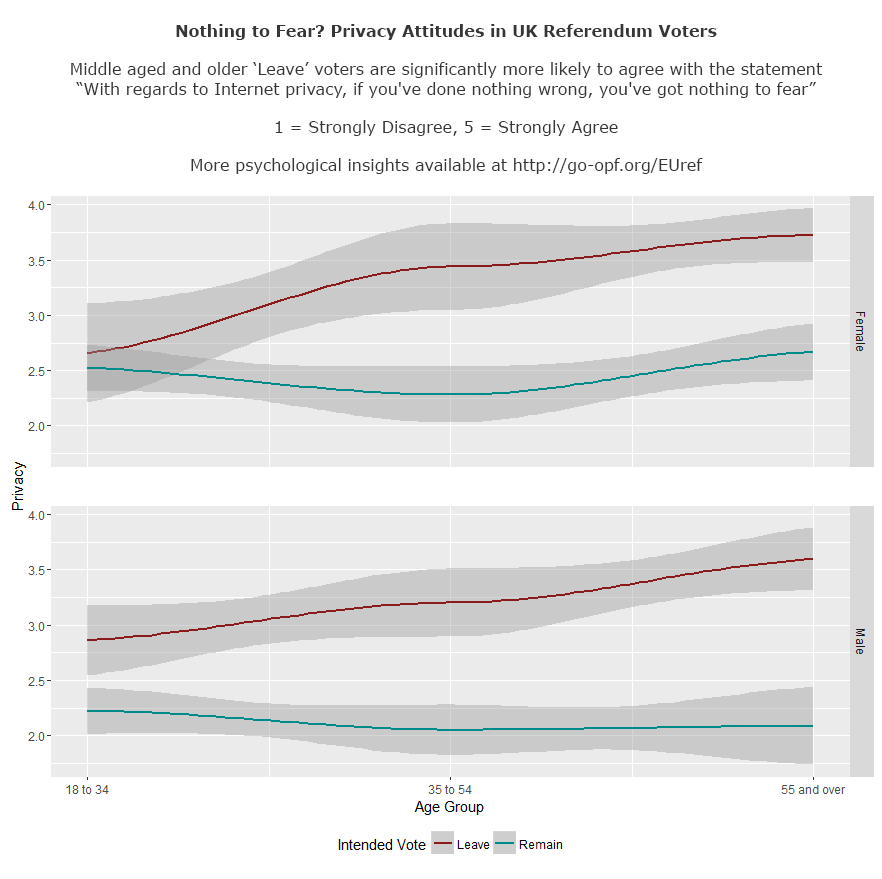
Figure 12. Graphs showing clear difference in attitudes to privacy
Voter Intention by Age Group and Sex
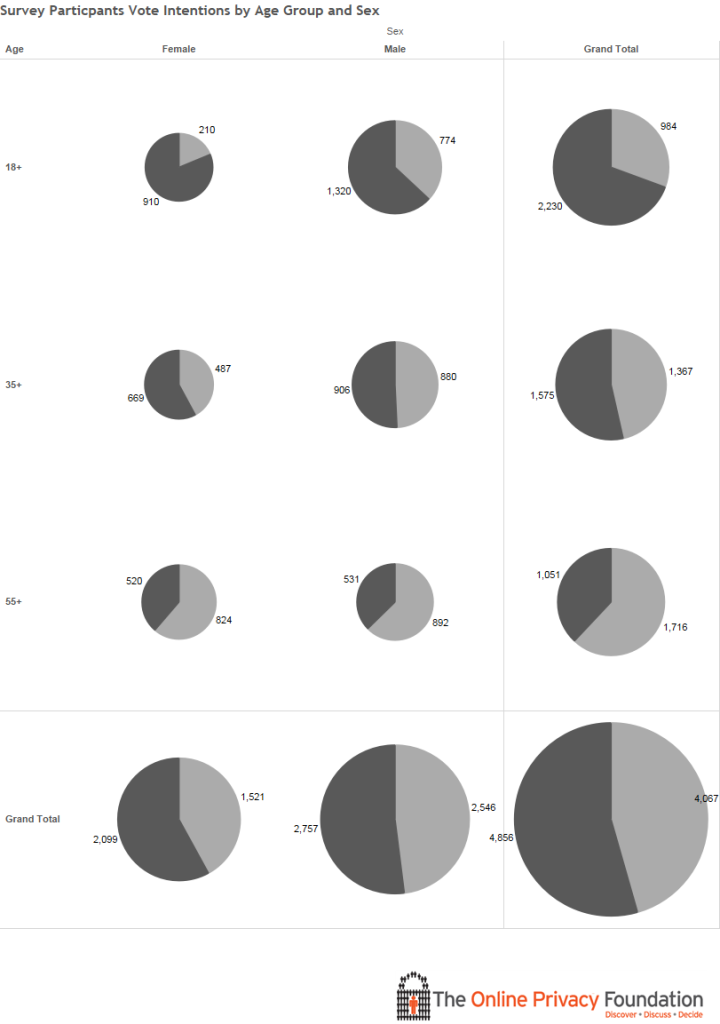
Dark Grey = Remain
Answers to 14 Questions Related to the EU Referendum
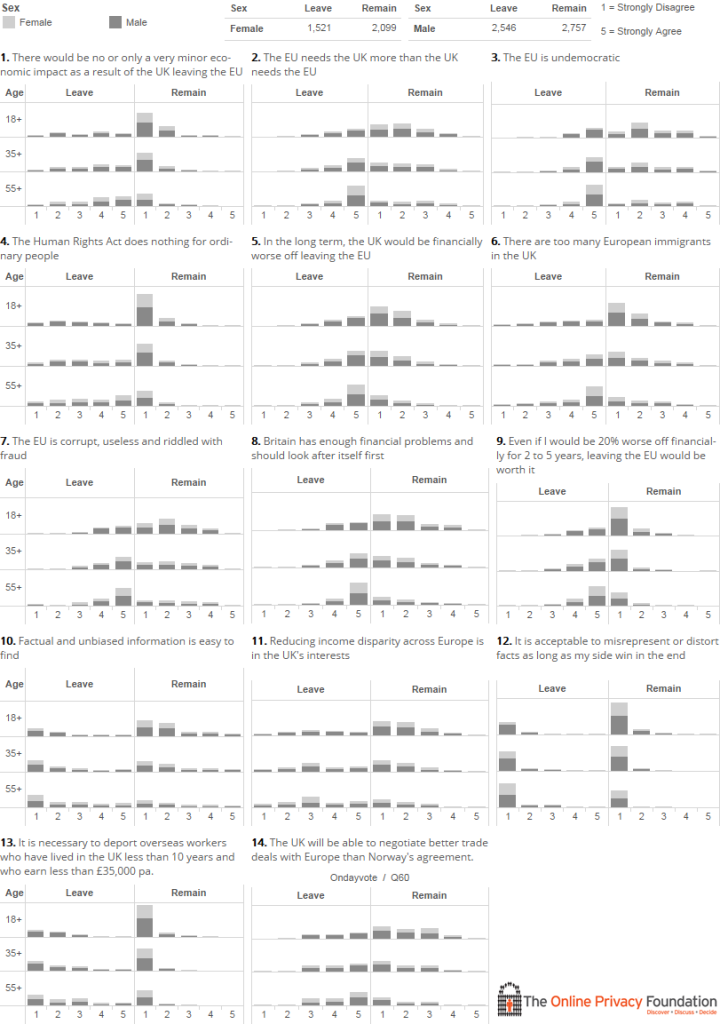
For further information, contact chris@onlineprivacyfoundation.org